Positron - a VSCode fork for Data Science
Python
R
IDE
Tool reviews
At the end of June, the public beta version of Positron was released. That’s almost 6 months ago, and the Positron team certainly hasn’t been idle! So what happened over the last half year? And is it worth switching? 👀 Some of my personal highlights about this IDE 👇🏻
ImportantKey notes
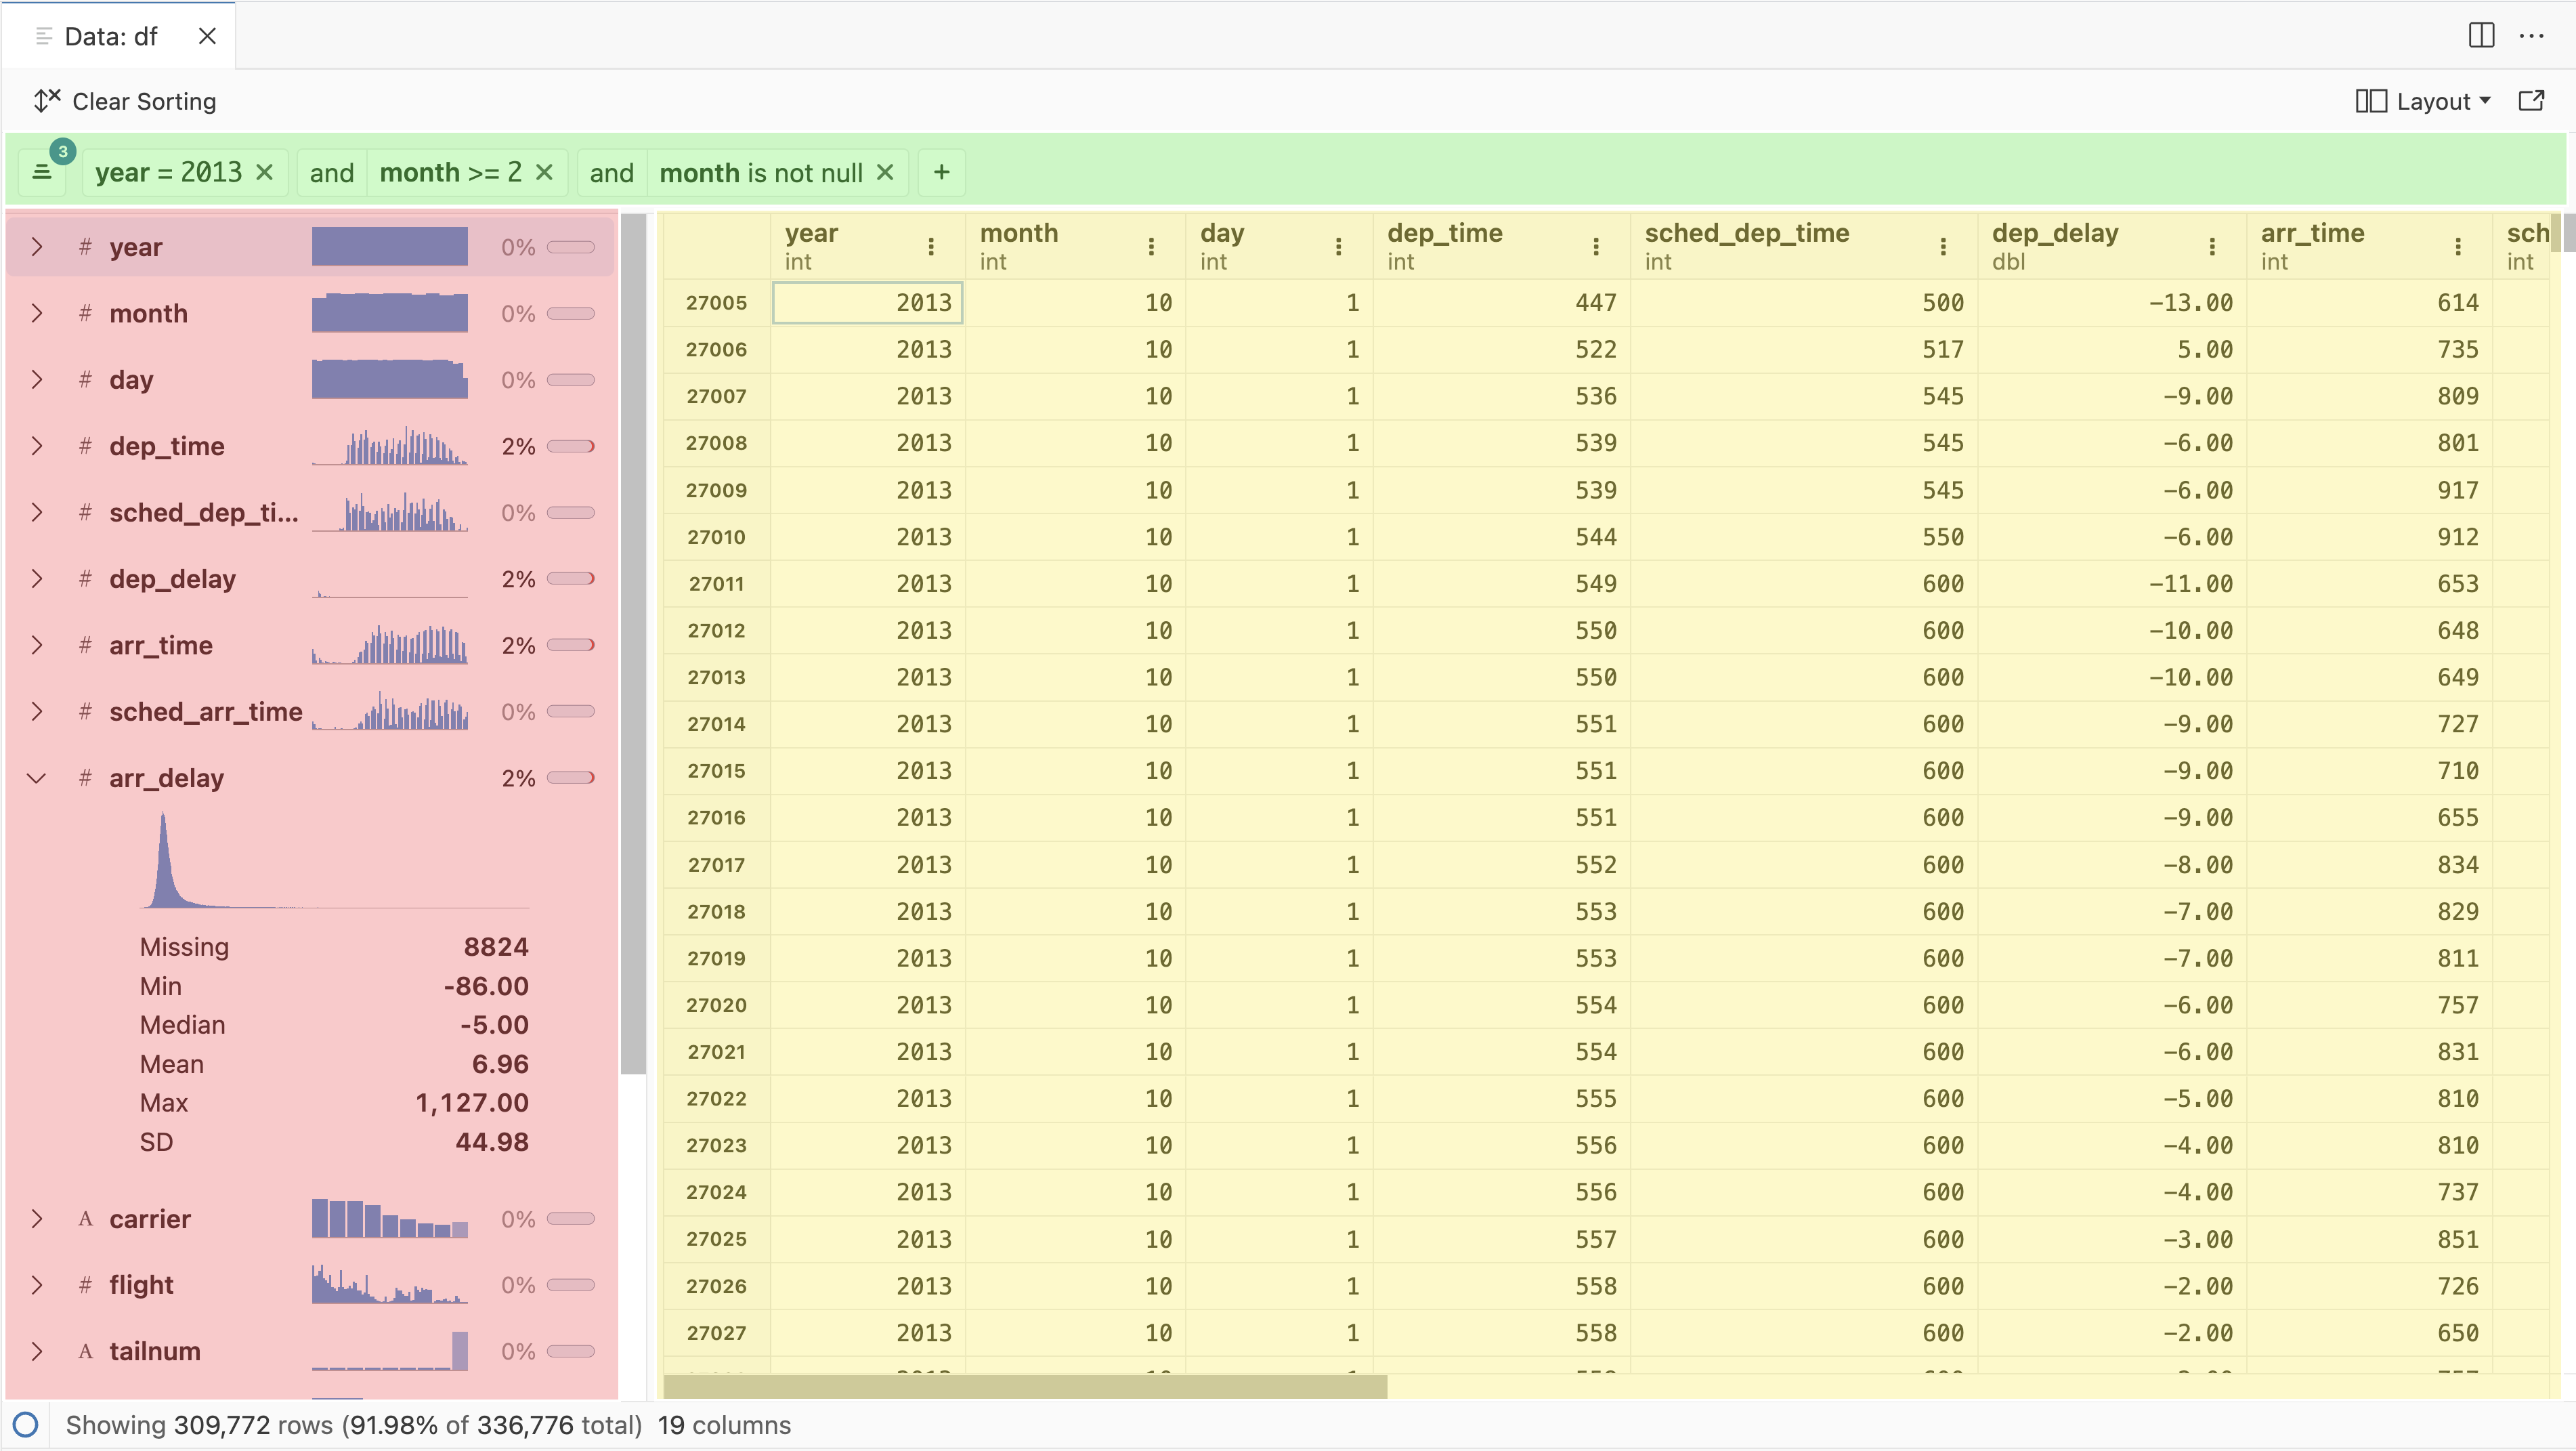
- The Data Explorer is a great way to inspect your data! You see things like the percentage of missing data or summary statistics per column. There’s multi-sorting and filtering. Some things are known in RStudio as well, but this Data Explorer goes a few steps further.
- Code completions works out-of-the-box for both R and Python.
- Help on hover: get some help when hovering over functions
- The use of extensions: you can use anything from Open VSX and it really makes the IDE “yours”. Some cool ones are: indent-rainbow, TODO highlight and GitLens.
- The test explorer: a separate pane for R packages with testthat that gives you all kind of insights and actions related to testing.
1 Hello Positron IDE – Key Features You Must Know
Positron is a next-generation data science IDE delivered by Posit. It’s still in active development, so it’s expected to see some features not working properly (more on this later). But, as mentioned in the introduction, it’s in public beta, which means you’re free to take it for a spin!
You can download the latest Positron release from the official GitHub releases page.
In essence, Positron is a fork of a famous IDE – Visual Studio Code. If you’re familiar with it, Positron should feel right at home. It has some neat features delivered out of the box, but you could configure most of these through plugins on a fresh VSCode installation.
2 RStudio Meets Visual Studio Code
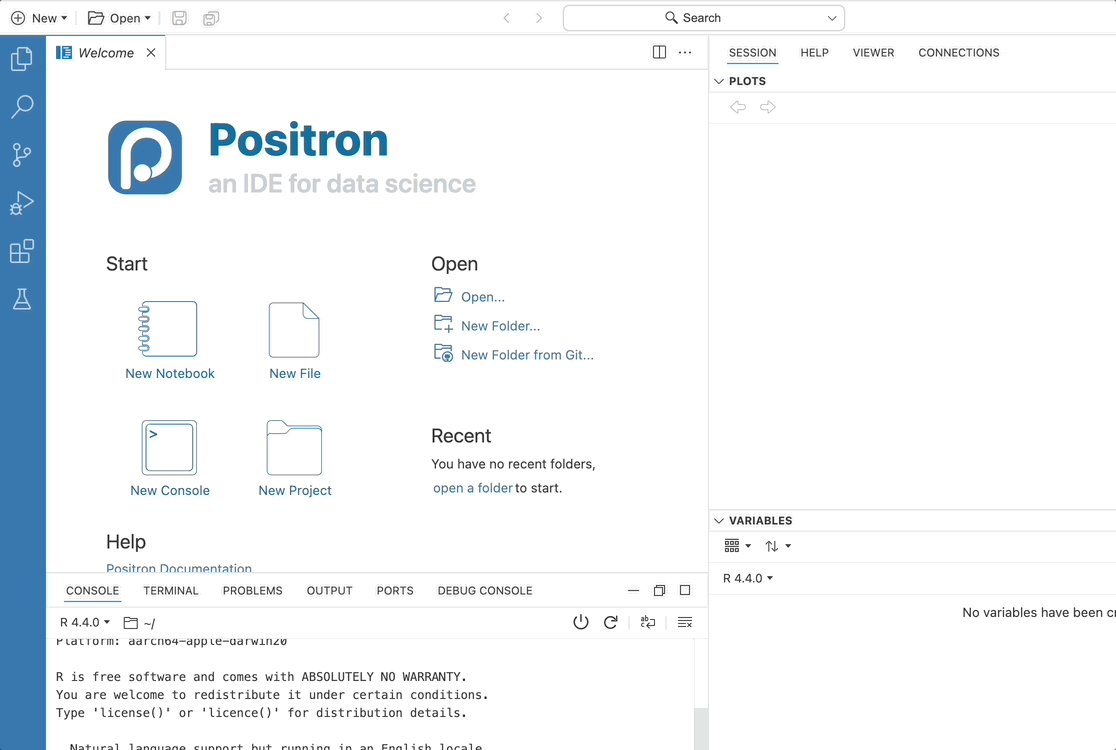
Here’s what you’ll see when you first launch Positron:
The top left panel allows you to start working on your data science projects – either in R or Python, through a notebook or file. Positron automatically detects installed programming languages and their version, but also picks up any virtual environments you’ve previously created:
3 Multi-Language Support
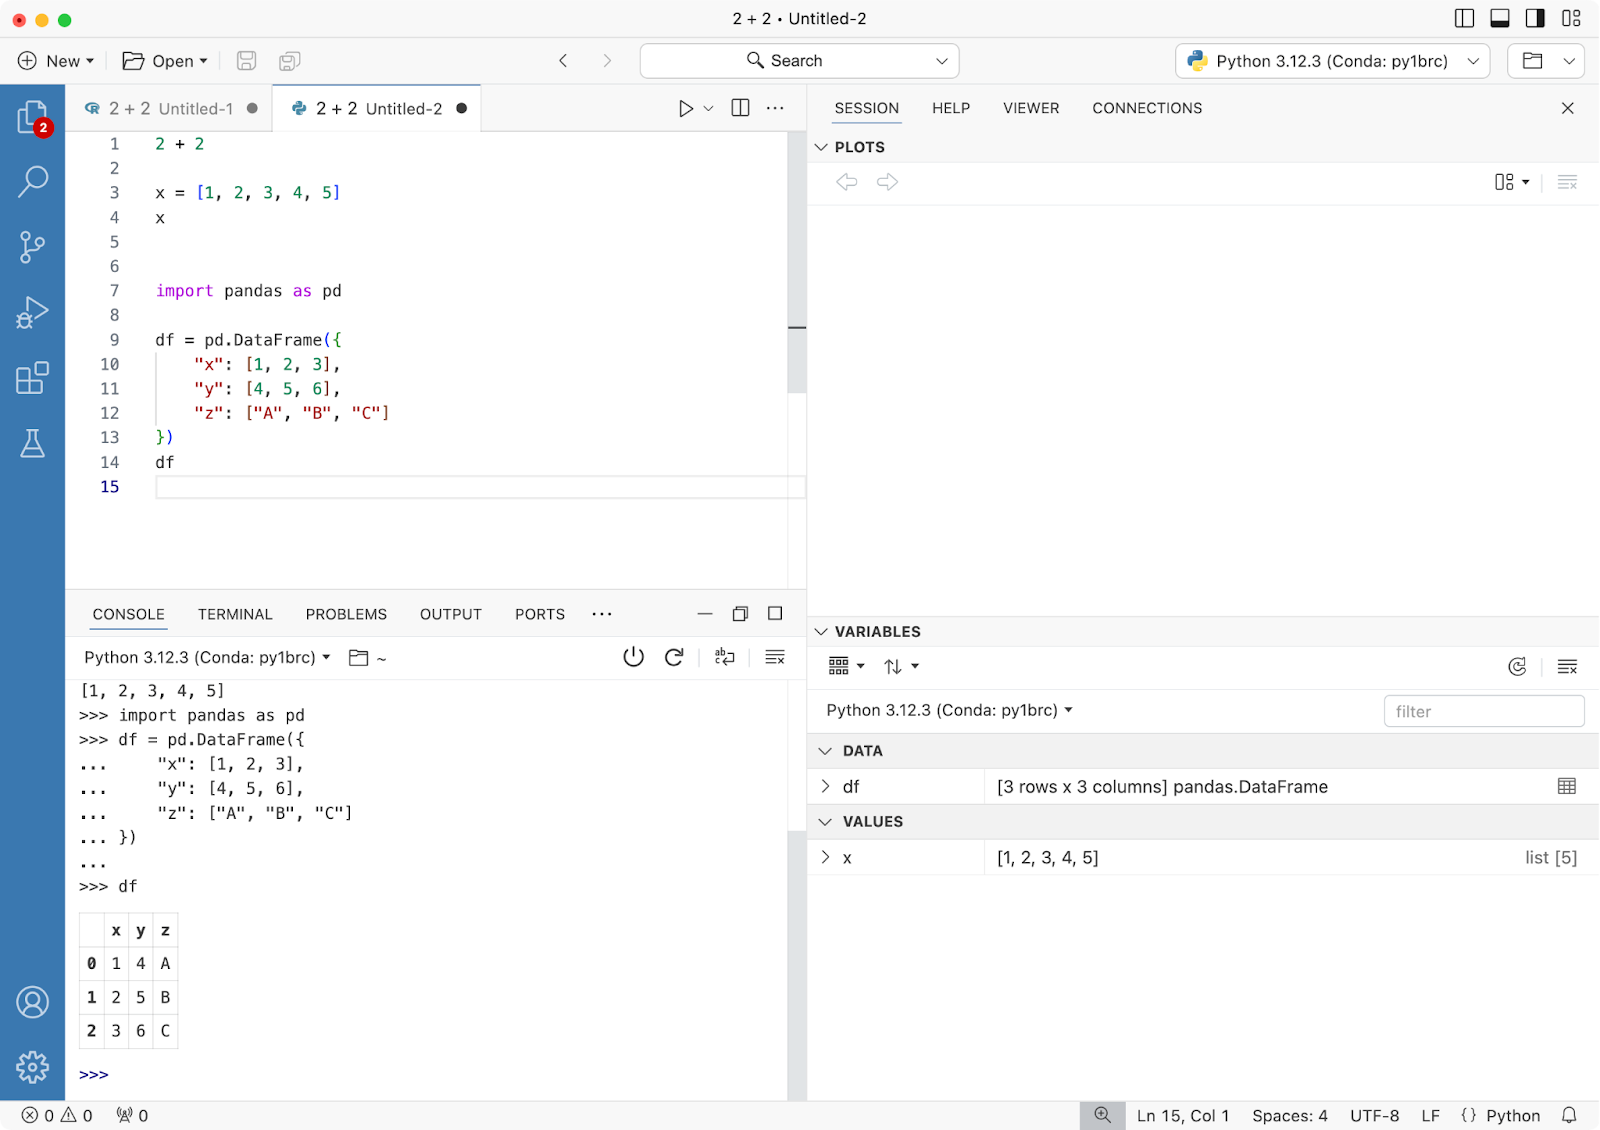
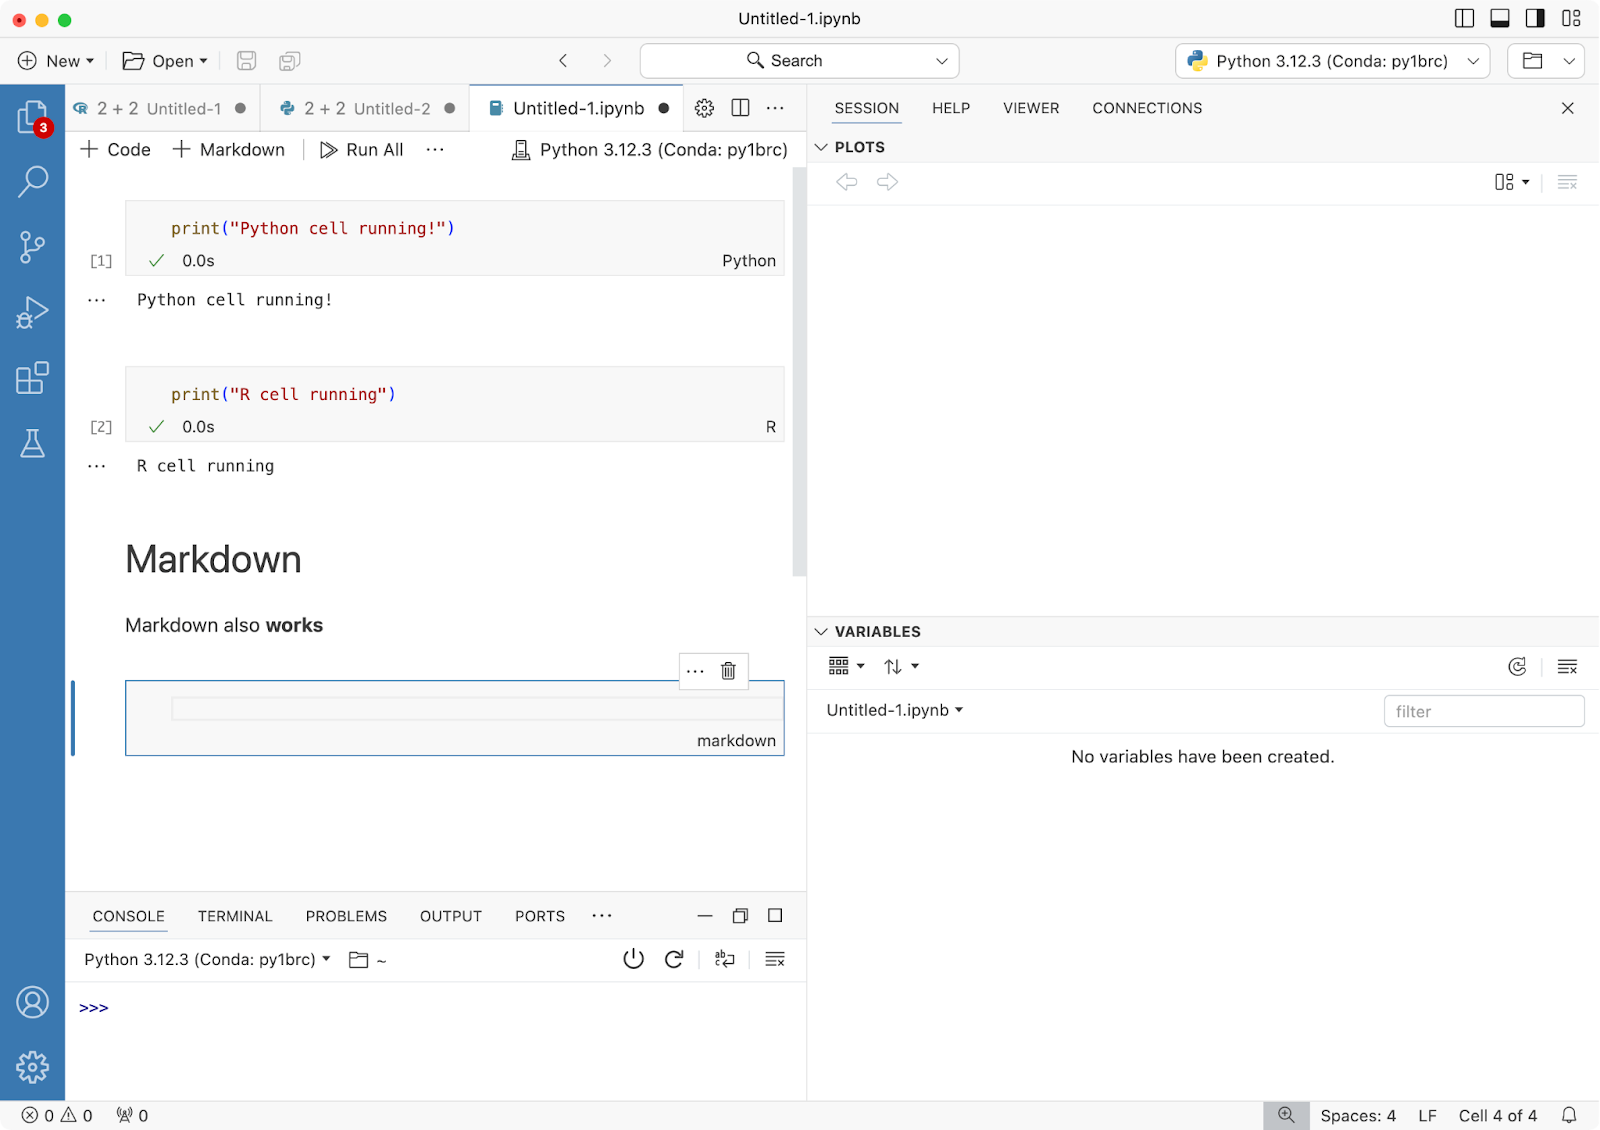
The big selling point of Positron IDE is that it comes configured for R and Python out of the box – Jupyter Notebooks included. This means you don’t have to set everything up from scratch, which in the case of R and Jupyter is not as easy as it sounds.
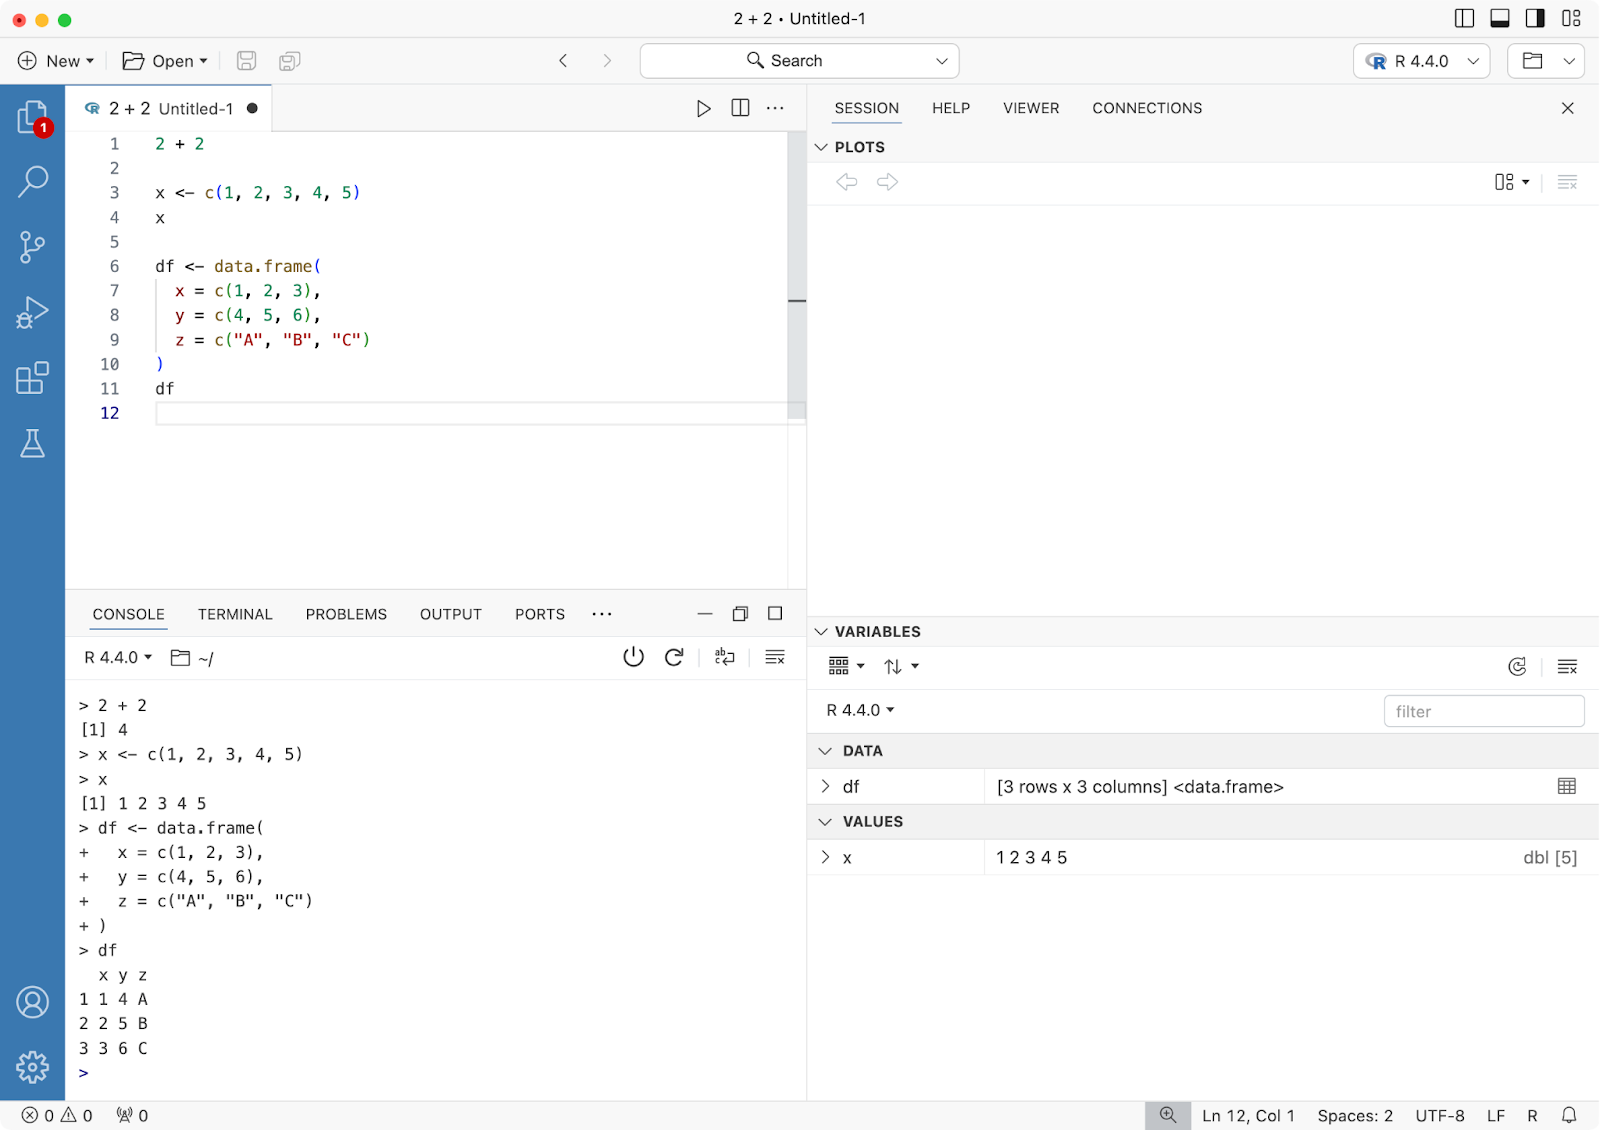
To create a new R script, click on the New File button on the welcome screen and select R File. Writing and running code works just like in RStudio – Command/Control + Enter will run the cell on which your cursor is located:
Because of this flexibility, you can also sprinkle text/markdown content between your cells to provide resources or explanations:
4 DataFrame Viewer
Dataframes are the core of all data science workflows, so having an IDE that can display all relevant information about them is a must-have feature.
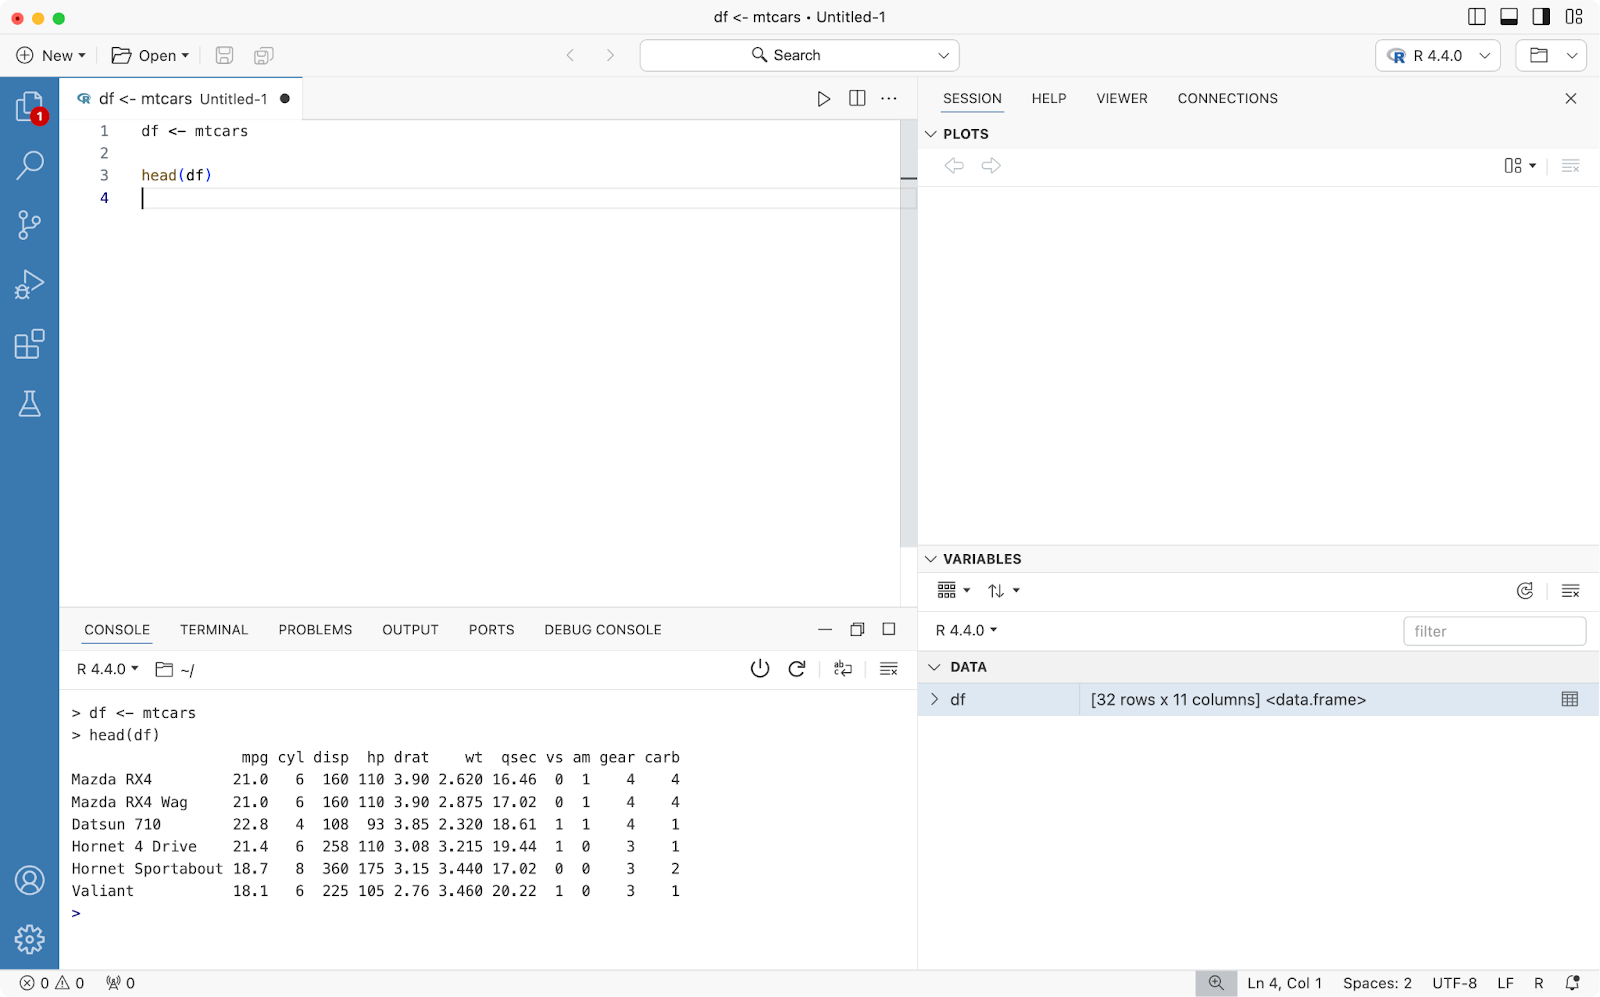
Positron allows you to print the dataframe content to the R console by calling R-specific functions, such as head():
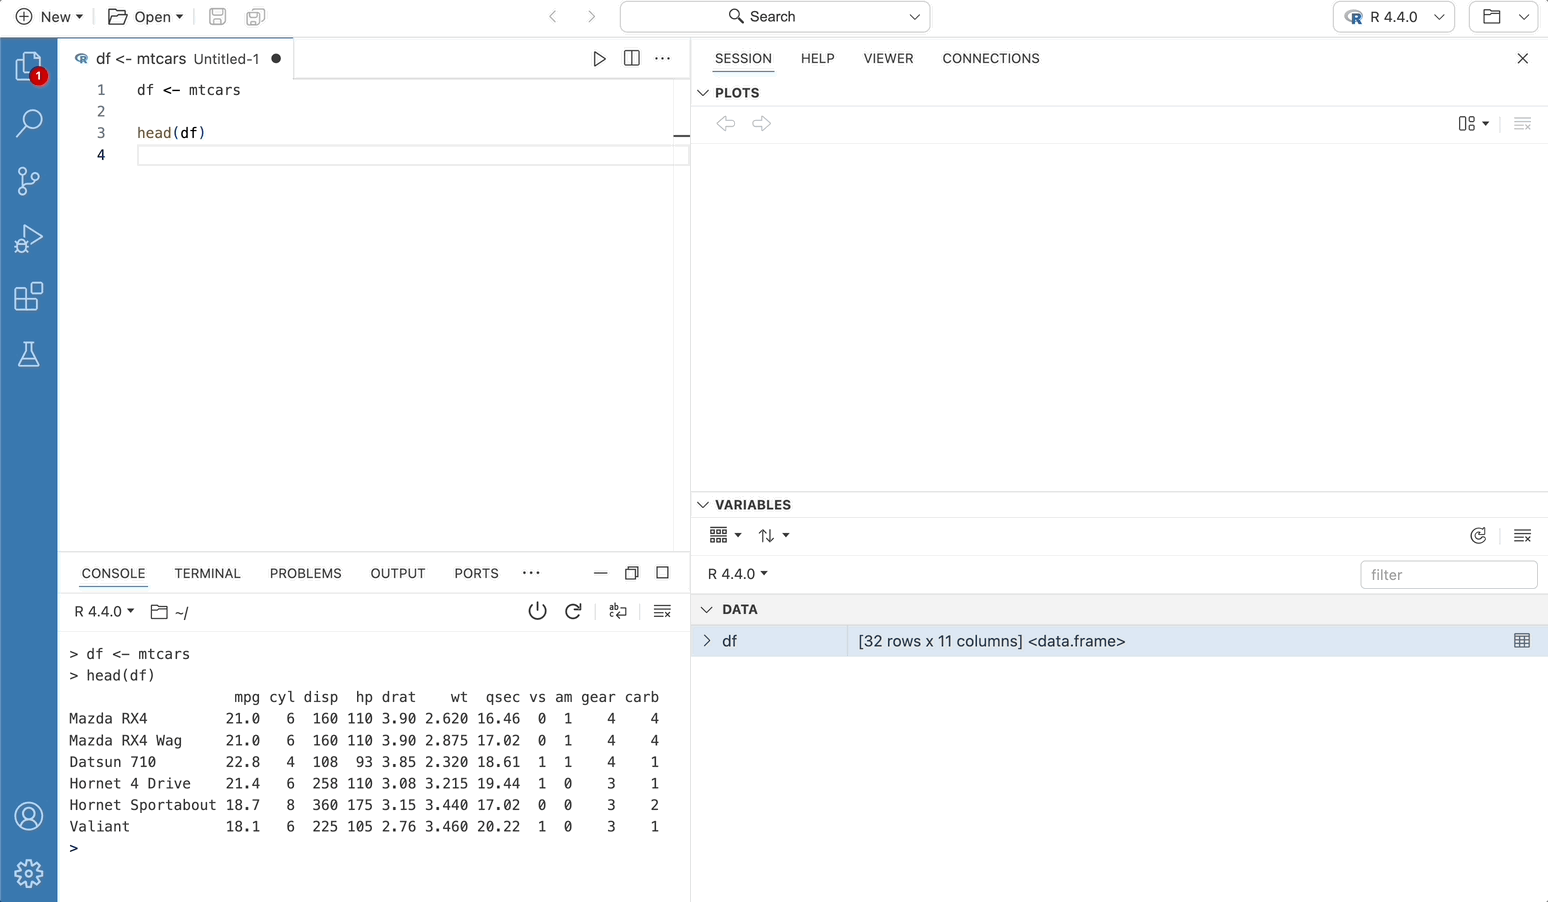
Once your dataframe is declared, you’ll see it in the Variables panel. You can expand the variable to view all columns and their respective values, or you can click on the table column to inspect the dataframe in an Excel-like fashion
The Data Explorer has three primary components, discussed in greater detail in the sections below:
- Data grid: Spreadsheet-like display of the individual cells and columns, as well as sorting
- Summary panel: Column name, type and missing data percentage for each column
- Filter bar: Ephemeral filters for specific columns
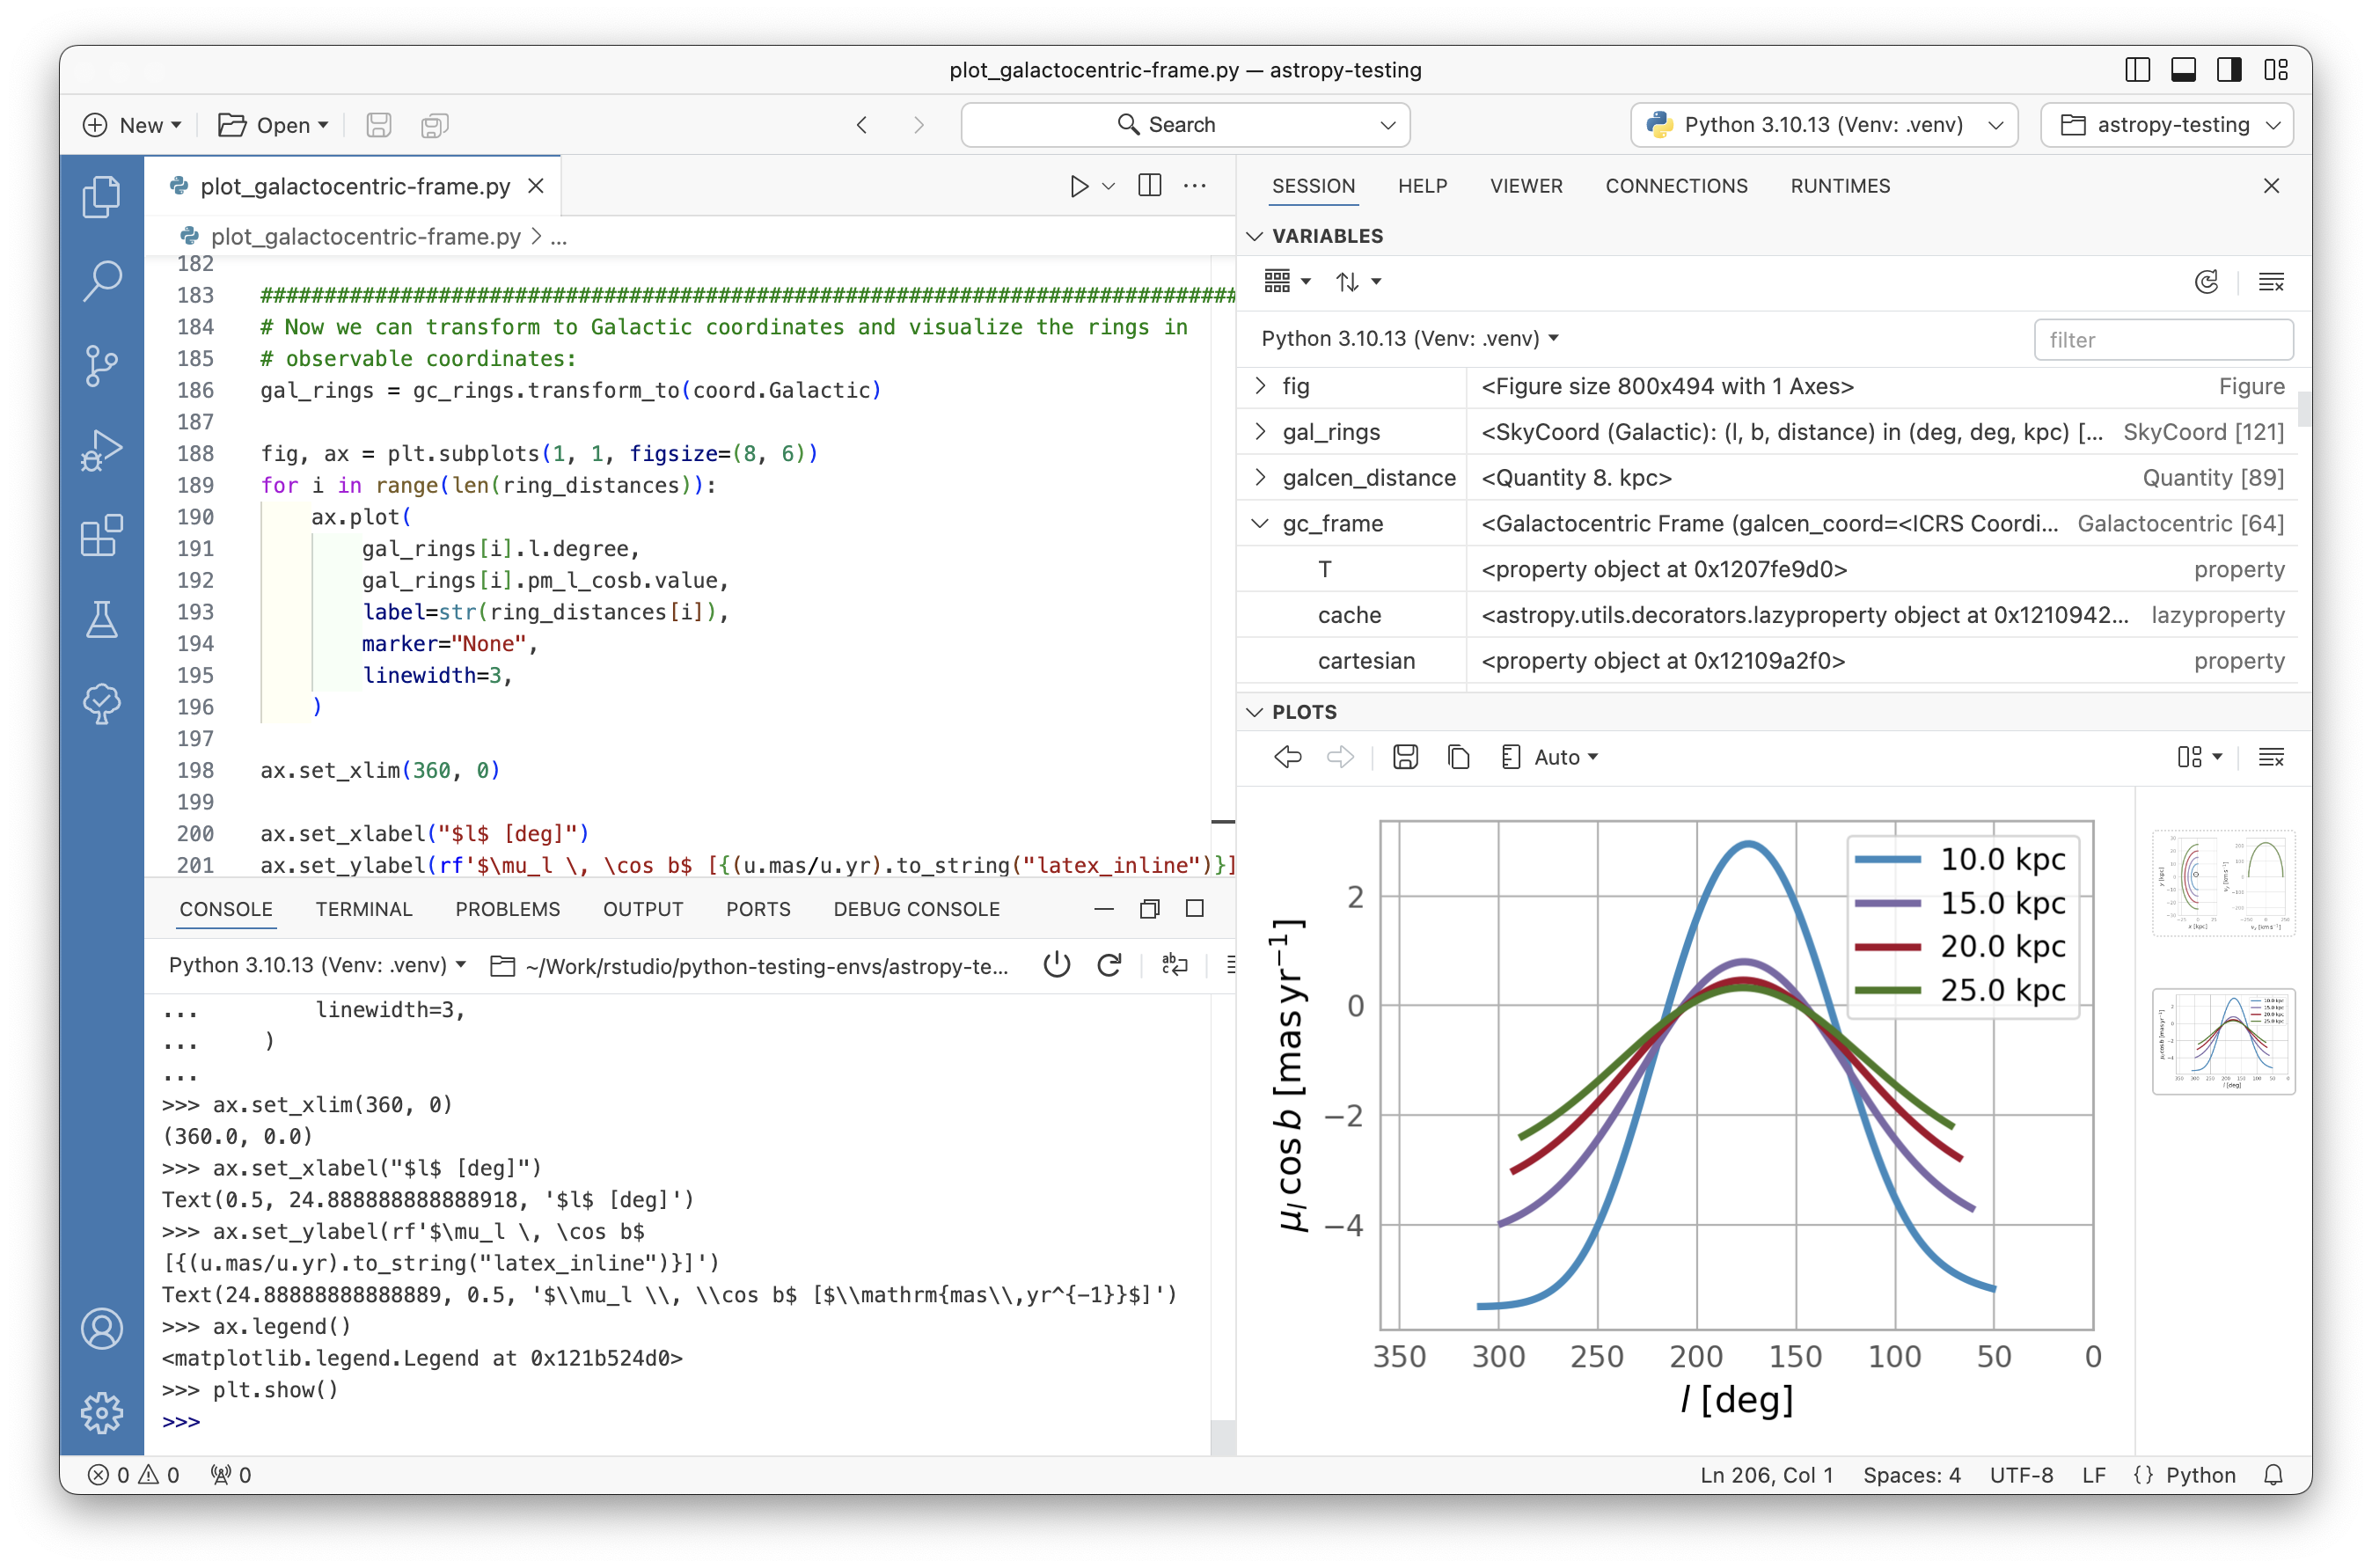
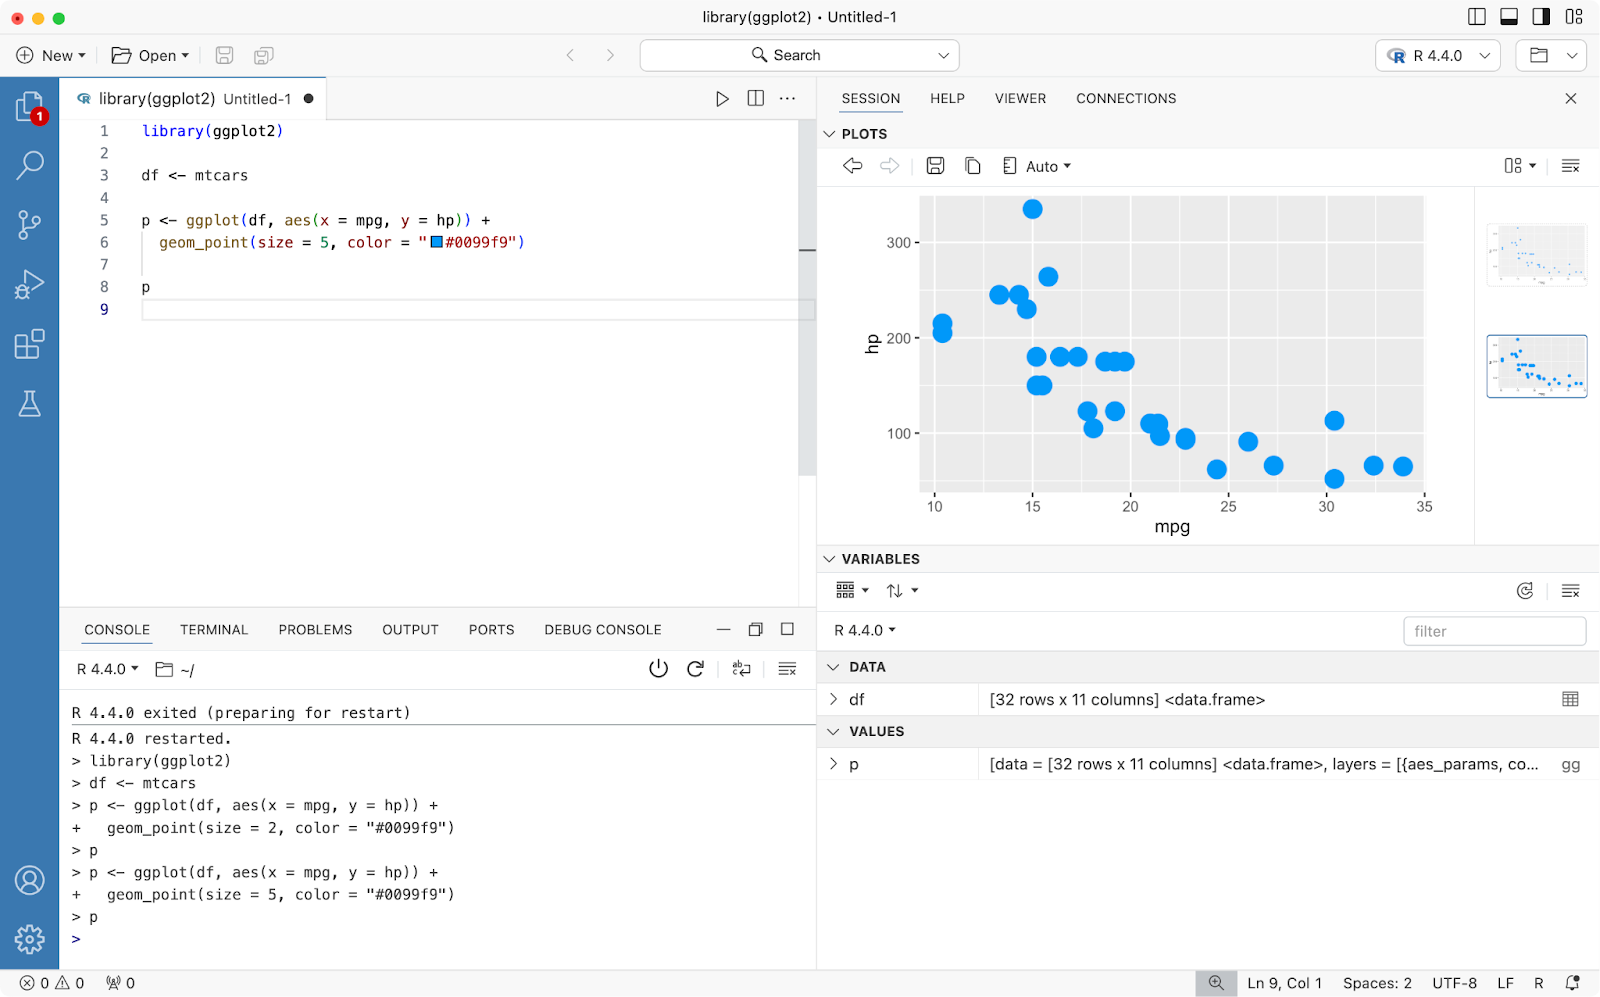
5 Plot Viewer
An amazing feature of RStudio is the plot viewer. You have a dedicated panel for visualizations, and you can easily cycle through multiple charts. Positron has the same feature, arguably with a somewhat updated interface. Creating a new chart won’t delete the old one, as you can easily navigate between them using the right-side panel
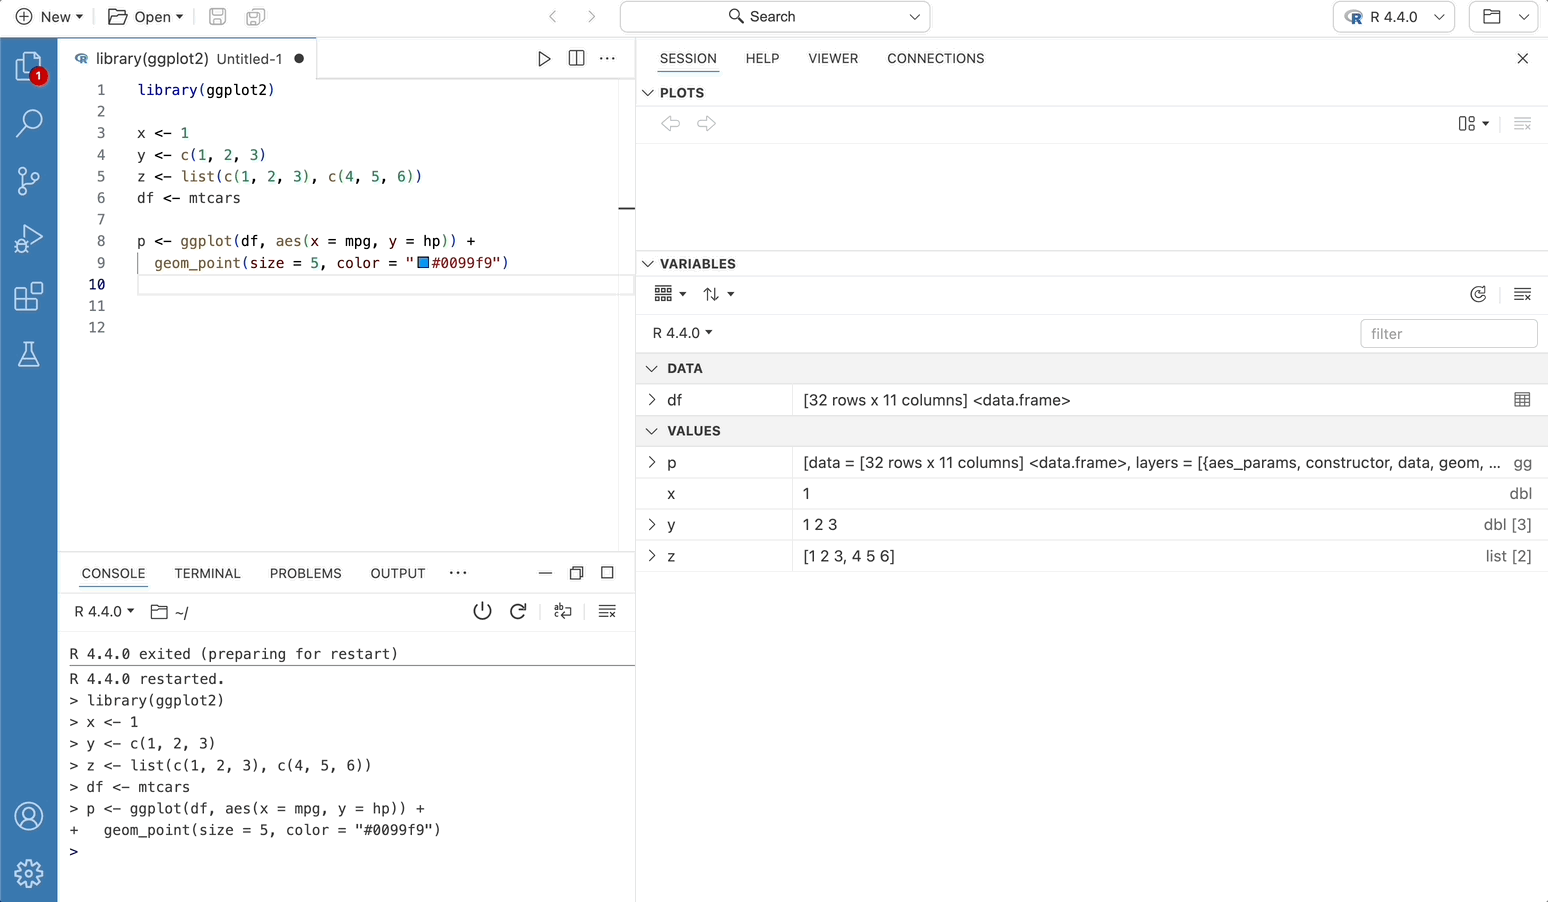
6 Variable Inspector
Being able to inspect complex objects, such as plots, is an essential feature for debugging code and making sure everything works as expected. RStudio also has this feature, but Positron allows you to dig deeper and has a sleeker-looking user interface. As you can see, you can drill down into all the small pieces that are combined to make complex objects.
Citation
BibTeX citation:
@online{nguyen_thanh2024,
  author = {Nguyen Thanh, Luong},
  title = {Positron - a {VSCode} Fork for {Data} {Science}},
  date = {2024-12-04},
  url = {https://ntluong95.github.io/profile/blog/2024-12-04_positron_review/},
  langid = {en}
}
For attribution, please cite this work as:
Nguyen Thanh, Luong. 2024. “Positron - a VSCode Fork for Data
Science.” December 4, 2024. https://ntluong95.github.io/profile/blog/2024-12-04_positron_review/.